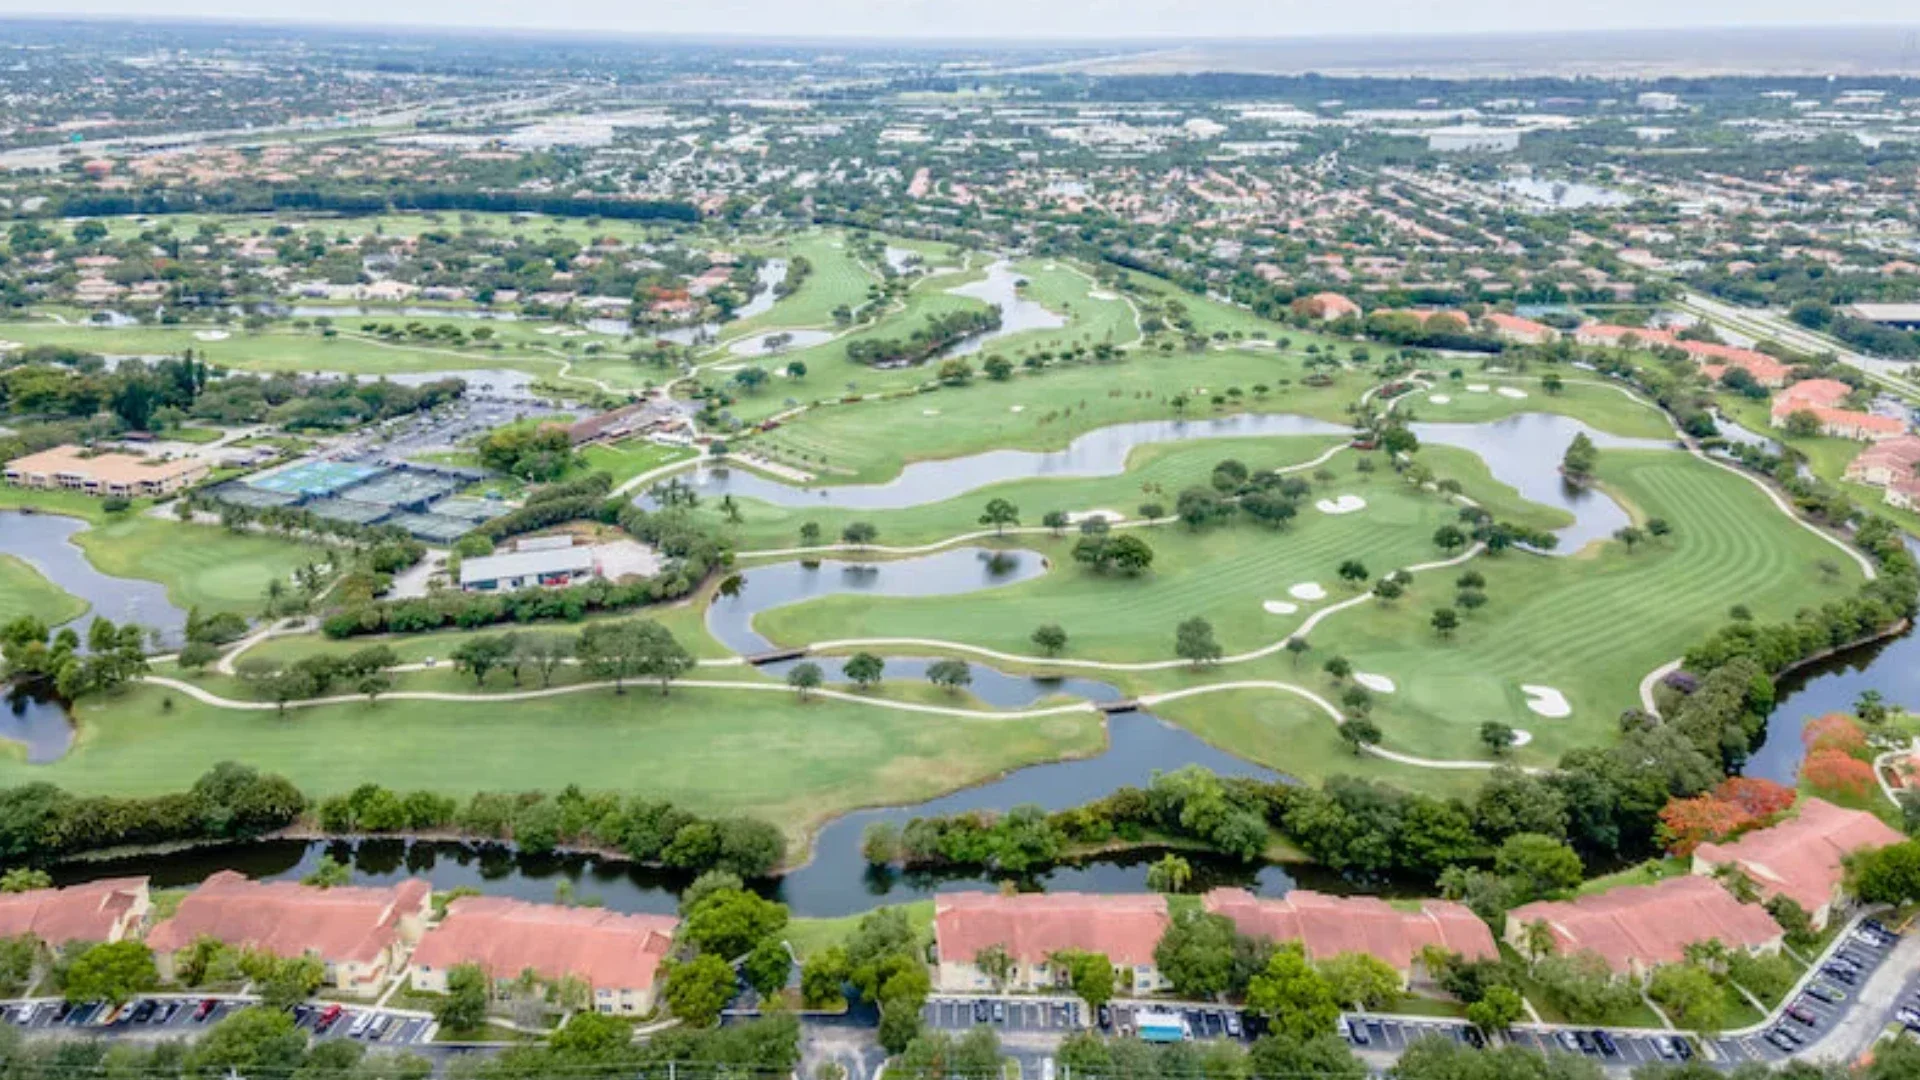
8 Communities Where Plantation Buyers Are Actually Closing Deals: 283 Closed Sales, Over 100 Neighborhoods:
If you're trying to figure out the best neighborhood in Plantation, FL to buy in 2026, the real answer isn't opinion — it's where buyers are actually closing deals. This report analyzes every closed single family home sale in Plantation from January 1 through June 29, 2026, and identifies the eight neighborhoods that produced the most transactions. Not my opinion, these are real facts. This is great information to remember so when the time comes to sell, you have idea of the high demand for actual buyers.
By Michele Noonan | Licensed Realtor | 22-Year Plantation & 20-Year Hawks Landing Resident | Keller Williams Luxury
Why Sales Volume Tells a Different Story Than Price
Most Plantation market reports focus on price. Price is important — but sales volume tells you something price cannot: where buyers are actually committing.
A neighborhood with high prices but few sales may reflect exclusivity, limited inventory, or simply a mismatch between seller expectations and buyer willingness. A neighborhood with strong consistent sales volume reflects genuine, sustained demand.
For sellers, volume data answers a critical question — how deep is the buyer pool for your specific community? For buyers, it answers an equally important question — how competitive is this market, and how quickly do I need to move when the right home appears?
What the First Half of 2026 Tells Us About the Plantation Market
Across all price points and neighborhoods, Plantation recorded 283 closed single family home sales in the first half of 2026. Those transactions were spread across 177 distinct subdivision names — reflecting just how diverse and fragmented the Plantation market truly is.
The eight neighborhoods in this report collectively accounted for a disproportionate share of that activity, driven by a combination of accessible price points, strong lifestyle appeal, and consistent buyer demand. Together they tell the story of where Plantation's most popular market actually lives.
The 8 Most Popular Plantation Neighborhoods: January to June 2026
1. Plantation Acres — Most Sales in Plantation
- Total closed sales January–June 2026: 28 homes
- Average sold price: $1,804,125
- Price range: $750,000 – $5,400,000
- Average days on market: 78 days
- Average square footage: 3,435 sq ft
- Homes with a pool: 23 of 28 (82%)
- Waterfront homes: 6 of 28 (21%)
- HOA: Most of the area is a voluntary HOA with a couple of private streets with a mandatory HOA.
Plantation Acres generated more closed sales than any other neighborhood in Plantation during the first half of 2026 — and it is not particularly close. With 28 transactions ranging from $750,000 to $5,400,000, this estate community demonstrated the kind of sustained, broad demand that no other Plantation neighborhood matched.
The appeal is straightforward: lots ranging from one to four or more acres, no master HOA for most of the community, and the kind of privacy and space that simply does not exist elsewhere in Plantation. For buyers who have achieved financial success and want room to breathe — a guest house, a tennis court, equestrian use, or simply acreage — Plantation Acres is the only option in Plantation that delivers it at scale.
The price range within the community is extraordinary. A $750,000 home and a $5,400,000 estate both carry a Plantation Acres address. That spread reflects the absence of HOA-enforced consistency — which is both the community's greatest appeal and its most important pricing complexity for sellers.
- Days on market breakdown:
- 13 homes sold in under 30 days
- 6 homes sold in 30–90 days
- 9 homes sold in over 90 days
- 2026 Highest Sale: 11750 NW 15th Street — $5,400,000 | 6 bed/6 bath | 6,942 sq ft (April 2026)
- 2026 Lowest Sale: 11280 NW 26th Street — $750,000 | 4 bed/2 bath | 1,883 sq ft (April 2026)
Additional notable closed sales include:
- 12331 SW 2nd Street — $4,500,000 | 4 bed/4 bath | DOM 217 (February 2026)
- 11780 NW 15th Street — $4,200,000 | 5 bed/5 bath | DOM 12 (March 2026)
- 11781 NW 15th Street — $3,900,000 | 5 bed/5 bath | DOM 29 (June 2026)
- 11420 NW 4th Street — $3,200,000 | 7 bed/8 bath | DOM 46 (January 2026)
- 11831 NW 9th Street — $2,825,000 | 5 bed/5 bath | DOM 37 (April 2026)
- 12321 NW 2nd Street — $2,799,000 | 4 bed/4 bath | DOM 153 (June 2026)
- 12000 NW 11th Street — $2,352,000 | 4 bed/4 bath | DOM 50 (June 2026)
- 12100 NW 5th Street — $1,700,000 | 5 bed/4 bath | DOM 2 (April 2026)
- 11430 NW 18th Street — $1,612,500 | 6 bed/4 bath | DOM 336 (March 2026)
2. Jacaranda Lakes — Highest # of Pool and Waterfront Homes of Any Popular Neighborhood
- Total closed sales January–June 2026: 18 homes
- Average sold price: $848,500
- Price range: $660,000 – $975,000
- Average days on market: 29 days
- Average square footage: 2,424 sq ft
- Homes with a pool: 18 of 18 (100%)
- Waterfront homes: 14 of 18 (78%)
- HOA: Yes
Jacaranda Lakes produced one of the most remarkable datasets of any neighborhood in this analysis. Every single home that closed in the first half of 2026 had a pool — 100% — and 78% were waterfront. No other popular neighborhood in Plantation comes close to those numbers.
With an average days on market of just 29 days and an average sale price of $848,500, Jacaranda Lakes demonstrated both strong demand and decisive buyers. Only one home in the entire dataset sat beyond 90 days. The other 17 sold within three months, with 11 going under contract in under 30 days.
For buyers who want a pool home with water views at a price point below the luxury threshold, Jacaranda Lakes offers one of the most compelling value propositions in Plantation. For sellers, the data speaks clearly — well-priced homes here move fast.
- Days on market breakdown:
- 11 homes sold in under 30 days
- 6 homes sold in 30–90 days
- 1 home sold in over 90 days
- 2026 Highest Sale: 1071 NW 97th Avenue — $975,000 | 4 bed/2 bath | 3,572 sq ft | Pool | Waterfront (April 2026)
- 2026 Lowest Sale: 9091 NW 11th Court — $660,000 | 4 bed/2 bath | 2,273 sq ft | Pool (February 2026)
Additional closed sales include:
- 1581 NW 101st Avenue — $950,000 | 4 bed/3 bath | Pool | Waterfront | DOM 38 (March 2026)
- 1030 NW 95th Terrace — $945,000 | 5 bed/3 bath | Pool | Waterfront | DOM 10 (May 2026)
- 9254 NW 18th Street — $945,000 | 4 bed/2 bath | Pool | Waterfront | DOM 5 (May 2026)
- 1078 NW 96th Avenue — $890,000 | 4 bed/2 bath | Pool | Waterfront | DOM 35 (June 2026)
- 9800 NW 10th Court — $885,000 | 4 bed/2 bath | Pool | Waterfront | DOM 39 (April 2026)
- 1380 NW 93rd Terrace — $870,000 | 5 bed/2 bath | Pool | Waterfront | DOM 29 (April 2026)
- 1261 NW 95th Avenue — $867,000 | 4 bed/2 bath | Pool | DOM 1 (June 2026)
- 9171 NW 13th Street — $855,000 | 4 bed/2 bath | Pool | Waterfront | DOM 13 (June 2026)
- 1060 NW 94th Terrace — $850,000 | 4 bed/2 bath | Pool | Waterfront | DOM 13 (February 2026)
3. Quatraine — Most Popular Entry-Level Single Family Community
- Total closed sales January–June 2026: 14 homes
- Average sold price: $487,429
- Price range: $437,000 – $540,000
- Average days on market: 48 days
- Average square footage: 1,499 sq ft
- Homes with a pool: 1 of 14 (7%)
- Waterfront homes: 2 of 14 (14%)
- HOA: Yes — approximately $125 to $138 per month. Includes community pool and common area maintenance.
Quatraine is the most popular entry-level single family community in Plantation, and it is not even close. With 14 closed sales in the first half of 2026, it produced more transactions than all but two neighborhoods in the entire city — at an average price of $487,429.
Located near Central Park, Quatraine offers well-maintained homes built between 1987 and 1991, typically 3 to 4 bedrooms and 2 bathrooms, ranging from approximately 1,376 to 1,820 square feet. For first-time buyers and investors, it represents one of the most accessible entry points into Plantation single family homeownership.
Note: Quatraine appears in MLS records under two legal plat descriptions — Jacaranda Parcel 608 and Jacaranda Parcel 216. These are sections of the same community.
- Days on market breakdown:
- 9 homes sold in under 30 days
- 2 homes sold in 30–90 days
- 3 homes sold in over 90 days
- 2026 Highest Sale: 9829 NW 2nd Court — $540,000 | 4 bed/2 bath | 1,494 sq ft (May 2026)
- 2026 Lowest Sale: 9834 NW 2nd Court — $437,000 | 3 bed/2 bath | 1,376 sq ft (February 2026)
Additional closed sales include:
- 9870 NW 2nd Street — $530,000 | 3 bed/2 bath | DOM 10 (April 2026)
- 9855 NW 2nd Court — $509,000 | 3 bed/2 bath | DOM 5 (June 2026)
- 829 NW 99th Avenue — $505,000 | 3 bed/2 bath | Pool | DOM 6 (June 2026)
- 9918 NW 2nd Court — $500,000 | 4 bed/2 bath | DOM 46 (January 2026)
- 9900 NW 2nd Court — $498,000 | 3 bed/2 bath | DOM 157 (April 2026)
- 9913 NW 2nd Street — $490,000 | 3 bed/2 bath | DOM 16 (April 2026)
- 805 NW 98th Avenue — $480,000 | 3 bed/2 bath | DOM 5 (January 2026)
- 828 NW 99th Avenue — $480,000 | 3 bed/2 bath | DOM 6 (April 2026)
- 875 NW 99th Avenue — $467,000 | 3 bed/2 bath | Waterfront | DOM 95 (March 2026)
4. Plantation Park — Most Popular Mid-Range Neighborhood
- Total closed sales January–June 2026: 13 homes
- Average sold price: $738,423
- Price range: $550,000 – $950,000
- Average days on market: 56 days
- Average square footage: 2,106 sq ft
- Homes with a pool: 12 of 13 (92%)
- Waterfront homes: 2 of 13 (15%)
- HOA: Some areas have an HOA
Plantation Park is one of the most compelling value stories in this entire analysis. With 13 closed sales, a 92% pool rate, and an average sold price of $738,423, it offered buyers a mid-range price point with near-universal pool access — a combination that is genuinely rare in Plantation.
Homes here were built primarily between 1959 and 1966, offering generous square footage relative to price. The neighborhood has a well-established character — tree-lined streets, larger lots, and consistent demand from buyers who want a pool home without crossing into the $800,000+ range.
- Days on market breakdown:
- 7 homes sold in under 30 days
- 3 homes sold in 30–90 days
- 3 homes sold in over 90 days
- 2026 Highest Sale: 400 SW 62nd Avenue — $950,000 | 4 bed/4 bath | 2,563 sq ft | Pool | Waterfront (April 2026)
- 2026 Lowest Sale: 142 SW 53rd Avenue — $550,000 | 3 bed/2 bath | 1,554 sq ft (February 2026)
Additional closed sales include:
- 6150 SW 7th Street — $850,000 | 5 bed/4 bath | Pool | DOM 146 (April 2026)
- 5660 SW 9th Street — $840,000 | 4 bed/2 bath | Pool | DOM 4 (April 2026)
- 640 SW 62nd Avenue — $779,500 | 3 bed/2 bath | Pool | Waterfront | DOM 173 (March 2026)
- 5620 SW 9th Street — $755,000 | 3 bed/2 bath | Pool | DOM 17 (April 2026)
- 5540 SW 3rd Street — $740,000 | 3 bed/2 bath | Pool | DOM 2 (May 2026)
- 280 SW 63rd Avenue — $740,000 | 4 bed/3 bath | Pool | DOM 19 (February 2026)
- 5341 SW 1st Street — $725,000 | 3 bed/2 bath | Pool | DOM 91 (May 2026)
- 5360 SW 9th Street — $725,000 | 5 bed/2 bath | Pool | DOM 84 (January 2026)
- 5320 SW 8th Street — $720,000 | 4 bed/2 bath | Pool | DOM 14 (January 2026)
5. Breezeswept Park Estates — No HOA, Consistent Demand
- Total closed sales January–June 2026: 9 homes
- Average sold price: $498,889
- Price range: $405,000 – $675,000
- Average days on market: 72 days
- Average square footage: 1,639 sq ft
- Homes with a pool: 3 of 9 (33%)
- Waterfront homes: 0 of 9 (0%)
- HOA: None
Breezeswept Park Estates is one of Plantation's oldest and largest neighborhoods, with 719 single family homes built primarily between 1959 and 1965. The absence of an HOA is a defining feature — buyers here value the freedom to personalize their property without monthly fees, approval processes, or restrictions.
With 9 closed sales ranging from $405,000 to $675,000, Breezeswept demonstrated consistent demand across a wide price range. Homes here tend to be modest in size but well located in central Plantation, close to major roadways, shopping, and employment centers.
- Days on market breakdown:
- 4 homes sold in under 30 days
- 3 homes sold in 30–90 days
- 2 homes sold in over 90 days
- 2026 Highest Sale: 4861 NW 5th Street — $675,000 | 4 bed/2 bath | 2,007 sq ft | Pool (April 2026)
- 2026 Lowest Sale: 4712 NW 1st Street — $405,000 | 3 bed/2 bath | 1,545 sq ft (March 2026)
Additional closed sales include:
- 475 NW 46th Terrace — $530,000 | 3 bed/2 bath | Pool | DOM 56 (March 2026)
- 776 NW 48th Avenue — $520,000 | 3 bed/2 bath | DOM 3 (April 2026)
- 4751 NW 5th Court — $510,000 | 3 bed/2 bath | DOM 38 (March 2026)
- 4688 NW 1st Street — $475,000 | 4 bed/2 bath | DOM 10 (May 2026)
- 151 NW 49th Avenue — $475,000 | 3 bed/2 bath | Pool | DOM 14 (April 2026)
- 4827 NW 2nd Court — $450,000 | 3 bed/2 bath | DOM 275 (June 2026)
- 4738 NW 5th Street — $450,000 | 3 bed/2 bath | DOM 79 (February 2026)
6. Minto Plantation — Fastest Selling Homes in 2026
- Total closed sales January–June 2026: 9 homes
- Average sold price: $605,222
- Price range: $510,000 – $725,000
- Average days on market: 25 days — fastest of all eight neighborhoods
- Average square footage: 1,785 sq ft
- Homes with a pool: 1 of 9 (11%)
- Waterfront homes: 6 of 9 (67%)
- HOA: Yes
Minto Plantation is the fastest moving community in this entire analysis with an average of just 25 days on market — and 7 of 9 homes sold in under 30 days. That kind of velocity in a market averaging 58–96 days across other price points is a significant data point.
Built between 1992 and 1994, Minto Plantation offers newer construction by Plantation standards, and 67% of homes in the H1 2026 dataset were waterfront — one of the highest waterfront rates of any neighborhood in this report outside of Jacaranda Lakes.
For sellers, Minto Plantation data is one of the clearest examples of what correct pricing produces. Homes here are not dramatically different from other Plantation communities in size or amenities — but they are moving at a pace that reflects strong buyer confidence.
- Days on market breakdown:
- 7 homes sold in under 30 days
- 1 home sold in 30–90 days
- 1 home sold in over 90 days
- 2026 Highest Sale: 1460 NW 104th Avenue — $725,000 | 4 bed/3 bath | 2,438 sq ft | Pool | Waterfront (May 2026)
- 2026 Lowest Sale: 1260 NW 110th Avenue — $510,000 | 3 bed/2 bath | 1,581 sq ft | Waterfront (January 2026)
Additional closed sales include:
- 10320 NW 15th Street — $720,000 | 4 bed/2 bath | Waterfront | DOM 5 (March 2026)
- 10843 NW 12th Court — $690,000 | 4 bed/2 bath | Waterfront | DOM 118 (March 2026)
- 10700 NW 12th Court — $615,000 | 4 bed/2 bath | DOM 5 (January 2026)
- 1264 NW 110th Avenue — $559,000 | 3 bed/2 bath | Waterfront | DOM 4 (May 2026)
- 10870 NW 12th Drive — $550,000 | 3 bed/2 bath | DOM 11 (June 2026)
- 10971 NW 12th Place — $549,000 | 3 bed/2 bath | DOM 6 (May 2026)
- 10717 NW 12th Manor — $529,000 | 3 bed/2 bath | Waterfront | DOM 23 (March 2026)
7. Hawks Landing — Highest Average Sale Price of Any Neighborhood
- Total closed sales January–June 2026: 8 homes
- Average sold price: $2,238,903
- Price range: $1,705,000 – $3,195,000
- Average days on market: 24 days — second fastest of all eight neighborhoods
- Average square footage: 4,032 sq ft
- Homes with a pool: 8 of 8 (100%)
- Waterfront homes: 6 of 8 (75%)
- HOA: Yes — 24-hour manned and roving guard-gated community with full clubhouse amenities.
Hawks Landing produced 8 closed sales in the first half of 2026 — every single one with a pool, and 75% with waterfront access — at an average sold price of $2,238,903. No other neighborhood in Plantation came close to that average.
What makes Hawks Landing particularly notable in this analysis is not just the price — it is the speed. With an average of just 24 days on market and 6 of 8 homes selling in under 30 days, Hawks Landing moved faster than almost every other neighborhood in Plantation despite commanding prices well above $2 million. That combination of premium pricing and rapid sale velocity is the clearest indicator of how deep and motivated the qualified buyer pool is for this community.
Note: Hawks Landing appears in MLS records under two subdivision names — Hawks Landing and Enclave 2nd Section. These are the same community. If you are researching sales on consumer platforms like Zillow, searching only one name will give you an incomplete picture.
- Days on market breakdown:
- 6 homes sold in under 30 days
- 1 home sold in 30–90 days
- 1 home sold in over 90 days
- 2026 Highest Sale: 580 Carrot Wood Terrace — $3,195,000 | 6 bed/7 bath | 5,514 sq ft | Pool | Waterfront (April 2026)
- 2026 Lowest Sale: 11098 Canary Island Court — $1,705,000 | 5 bed/3 bath | 3,076 sq ft | Pool (February 2026)
Additional closed sales include:
- 61 Peregrine Avenue — $2,655,000 | 5 bed/4 bath | Pool | Waterfront | DOM 4 (May 2026)
- 770 Leigh Palm Avenue — $2,325,000 | 5 bed/5 bath | Pool | Waterfront | DOM 8 (June 2026)
- 127 Swan Avenue — $2,222,222 | 5 bed/4 bath | Pool | DOM 94 (March 2026)
- 661 Cardinal Street — $2,149,000 | 5 bed/4 bath | Pool | Waterfront | DOM 4 (March 2026)
- 10995 Whitehawk Street — $1,860,000 | 4 bed/3 bath | Pool | Waterfront | DOM 10 (May 2026)
- 321 Windmill Palm Avenue — $1,800,000 | 5 bed/5 bath | Pool | Waterfront | DOM 20 (January 2026)
8. Mirror Lake Estates — Pool Homes, Consistent Value
- Total closed sales January–June 2026: 8 homes
- Average sold price: $639,550
- Price range: $575,000 – $705,000
- Average days on market: 41 days
- Average square footage: 1,892 sq ft
- Homes with a pool: 7 of 8 (88%)
- Waterfront homes: 2 of 8 (25%)
- HOA: No
Mirror Lake Estates rounds out the top eight with 8 closed sales, an 88% pool rate, and a tightly clustered price range between $575,000 and $705,000. Built primarily between 1969 and 1972, these are well-established homes on generous lots with consistent appeal among buyers who want a pool home in the $600,000 range.
The neighborhood's consistency is what stands out. Seven of eight homes had a pool. Prices stayed within a $130,000 range across all sales. And with an average DOM of 41 days, Mirror Lake Estates moved at a pace that reflects steady, reliable demand rather than speculative volatility.
- Days on market breakdown:
- 6 homes sold in under 30 days
- 1 home sold in 30–90 days
- 1 home sold in over 90 days
- 2026 Highest Sale: 1431 NW 70th Avenue — $705,000 | 4 bed/2 bath | 1,820 sq ft | Pool (May 2026)
- 2026 Lowest Sale: 7241 NW 10th Place — $575,000 | 4 bed/2 bath | 1,829 sq ft (April 2026)
Additional closed sales include:
- 7200 NW 11th Court — $693,000 | 4 bed/2 bath | Pool | DOM 4 (March 2026)
- 7310 NW 13th Court — $669,900 | 4 bed/2 bath | Pool | Waterfront | DOM 88 (June 2026)
- 7221 NW 10th Court — $635,000 | 4 bed/2 bath | Pool | DOM 8 (April 2026)
- 1341 NW 71st Avenue — $630,000 | 3 bed/2 bath | Pool | DOM 7 (June 2026)
- 7481 NW 11th Place — $628,500 | 4 bed/2 bath | Pool | Waterfront | DOM 19 (June 2026)
- 7441 NW 13th Street — $580,000 | 4 bed/2 bath | Pool | DOM 177 (January 2026)
What This Data Means for Plantation Homeowners
If you own a home in any of these eight neighborhoods, the H1 2026 data gives you a clear picture of what buyers in your community are actually paying — not what they are offering, not what they are browsing, but what they are committing to at the closing table.
The most important takeaway across all eight neighborhoods is consistent: homes priced correctly moved fast. The outliers that sat beyond 90 days in every community shared a common thread — pricing that did not align with what buyers were willing to pay for comparable properties. In Minto Plantation, where the average was 25 days, only one home exceeded 90 days on market. In Jacaranda Lakes, where the average was 29 days, only one home sat beyond 90 days. The pattern is unmistakable.
For sellers in any of these communities, the question is not whether demand exists — it clearly does. The question is whether your pricing strategy positions your home to capture that demand in the first 30 days, or surrenders momentum to a longer, more costly listing cycle.
What This Data Means for Plantation Buyers
For buyers, this report identifies where competition is real and where speed matters. In Jacaranda Lakes, 11 of 18 homes went under contract in under 30 days. In Minto Plantation, 7 of 9 homes closed within a month. In Hawks Landing, 6 of 8 homes sold in under 30 days at an average price of $2.2 million.
In these communities, the buyers who succeed are the ones who are pre-approved, know their budget, and move decisively when the right home appears. Buyers who browse casually or wait to see if prices drop often find that well-positioned homes disappear before they can act.
Thinking About Buying or Selling in Plantation?
Whether you own in one of these eight communities or are considering a purchase in Plantation, the data in this report gives you a foundation — not a substitute for a personalized market analysis based on your specific property, neighborhood, and timing.
Every address in Plantation has its own story, and the difference between a well-positioned listing and a generic one shows up directly at the closing table.
Schedule a No-Pressure Consultation
Michele Noonan is a South Florida listing specialist with over 20 years as a Hawks Landing resident and 22 years in Plantation. She serves homeowners in Hawks Landing, Plantation, Weston, Davie, Fort Lauderdale, Coral Springs, Pompano Beach, Lauderdale-by-the-Sea, and surrounding Broward County communities. All market data reflects current and historical MLS activity as of the publish date. Her finance-driven approach combines hyperlocal market expertise with strategic pricing and professional marketing to help sellers maximize their results at the closing table.
📞 954-882-8900 | Keller Williams Luxury
Related Articles
5 Most Expensive Neighborhoods in Plantation
20 Years of Hawks Landing Sales Data