
20 Years Inside Hawks Landing: What's Changed in Real Estate Values — and What Seller & Buyers Need to Know
Every closed sale in Hawks Landing since 2006 answers two questions homeowners here actually care about: which streets have appreciated the most, and what happens to home values when the market turns. That's valuable whether you're deciding when to sell or trying to figure out where in the community holds its value best if you're buying. I've lived in Hawks Landing for nearly 20 years and been a licensed agent since 1996 — this isn't my opinion of this market, it's every recorded MLS sale, broken down by year, street, and home size. If you're deciding when to sell or wondering whether your street is one of the ones that's outperformed the rest, this is the real data behind that answer.
HAWKS LANDING ANNUAL SALES & AVERAGE PRICE PER SQUARE FOOT, EVERY YEAR SINCE 2006
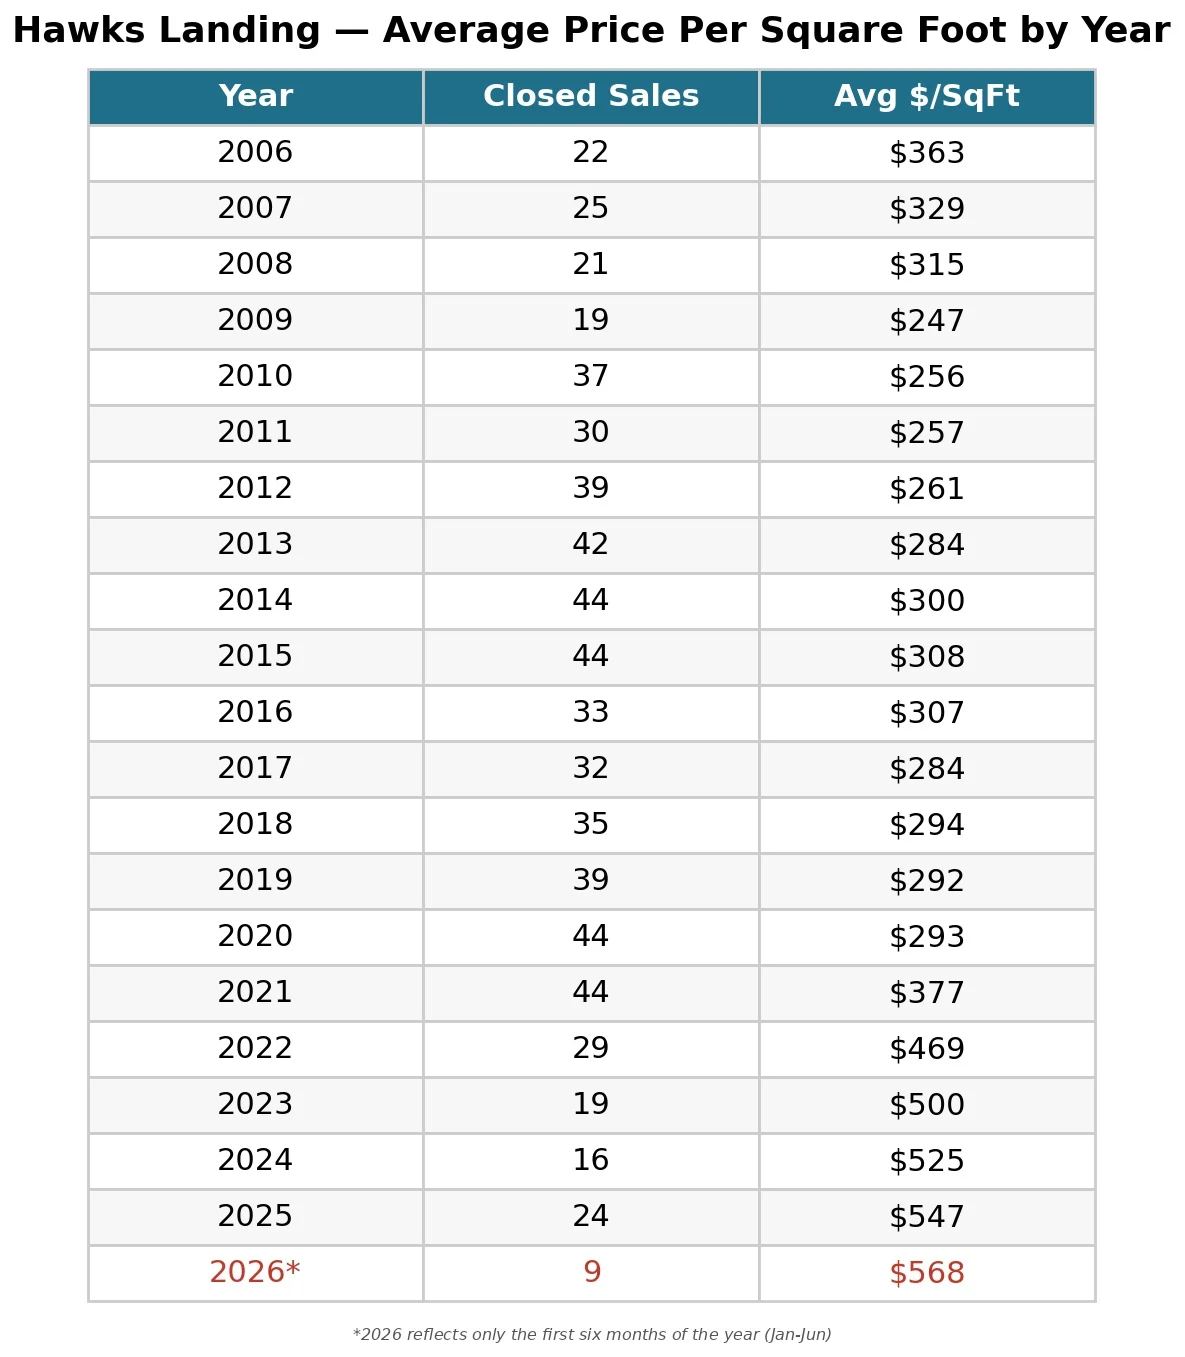
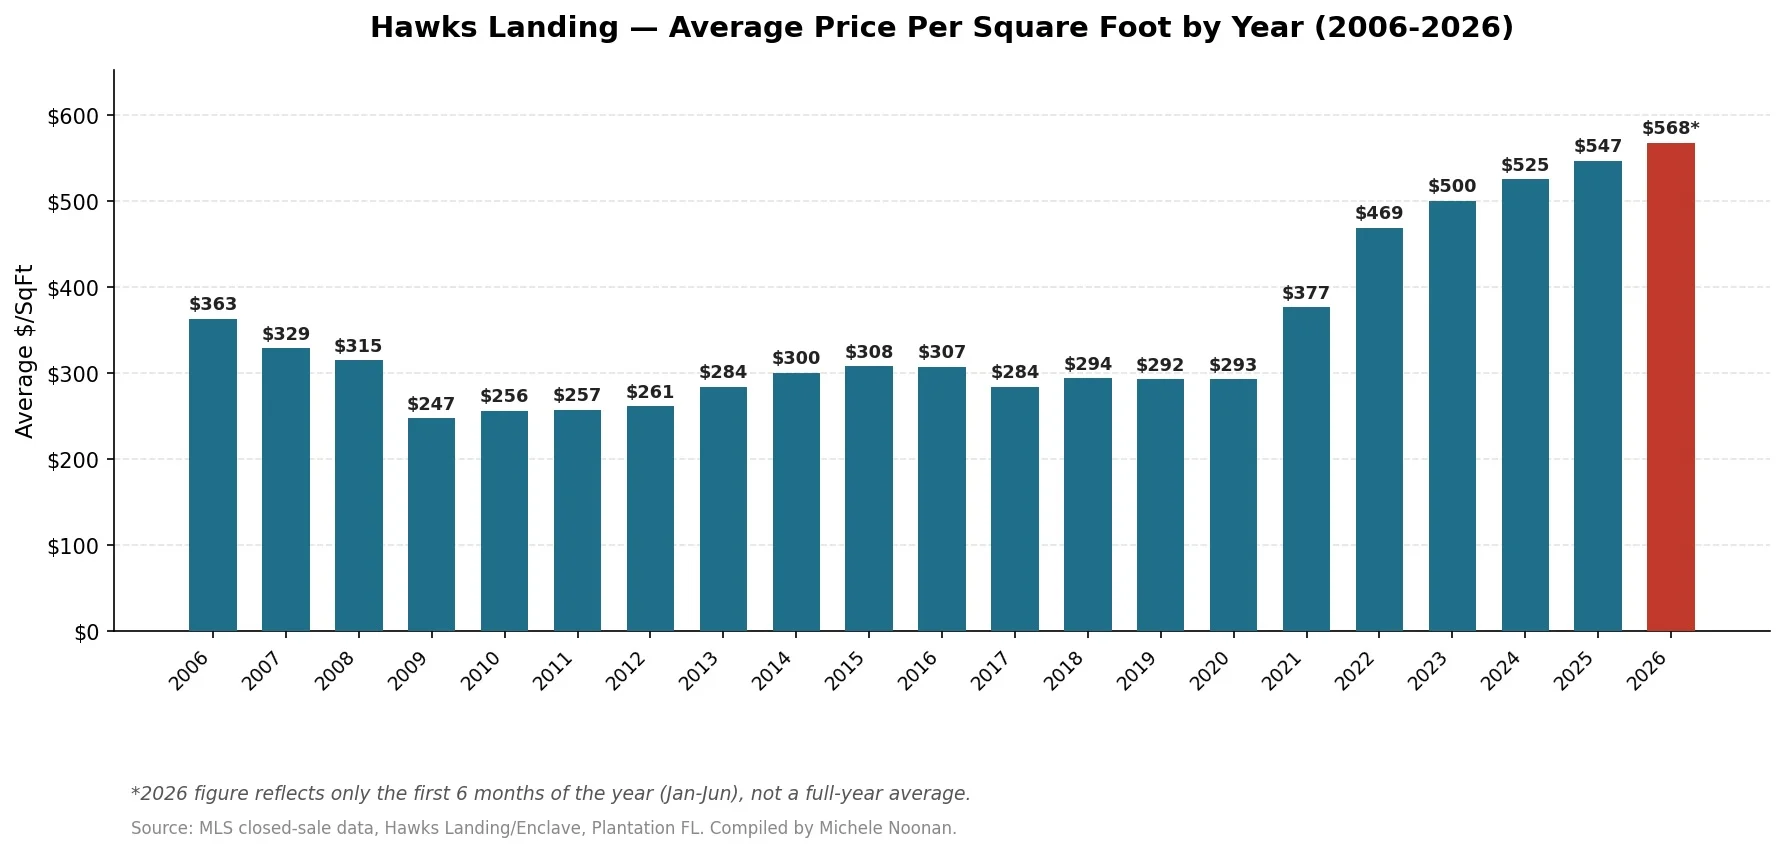
Three straight years of declines from 2006 to 2009 (a 32% drop), a full decade essentially parked between $250 and $310 (2010 through 2020), and then a near-doubling in just five years after that.
WHY PRICE PER SQUARE FOOT ISN'T THE SAME FOR EVERY HOME — A LOOK BY HOME SIZE
Here's something worth being upfront about: applying one community-wide price-per-square-foot number to every home isn't quite fair. A 2,700 square foot home and a 5,300 square foot home don't trade at the same rate per foot, and blending them together hides that. So I broke the same 20 years of sales into four home-size groups and tracked each one separately, across four time periods (grouped in multi-year spans so every number below reflects a real, reliable sample size rather than one or two sales).
HAWKS LANDING Average $/SqFt by home size and period:
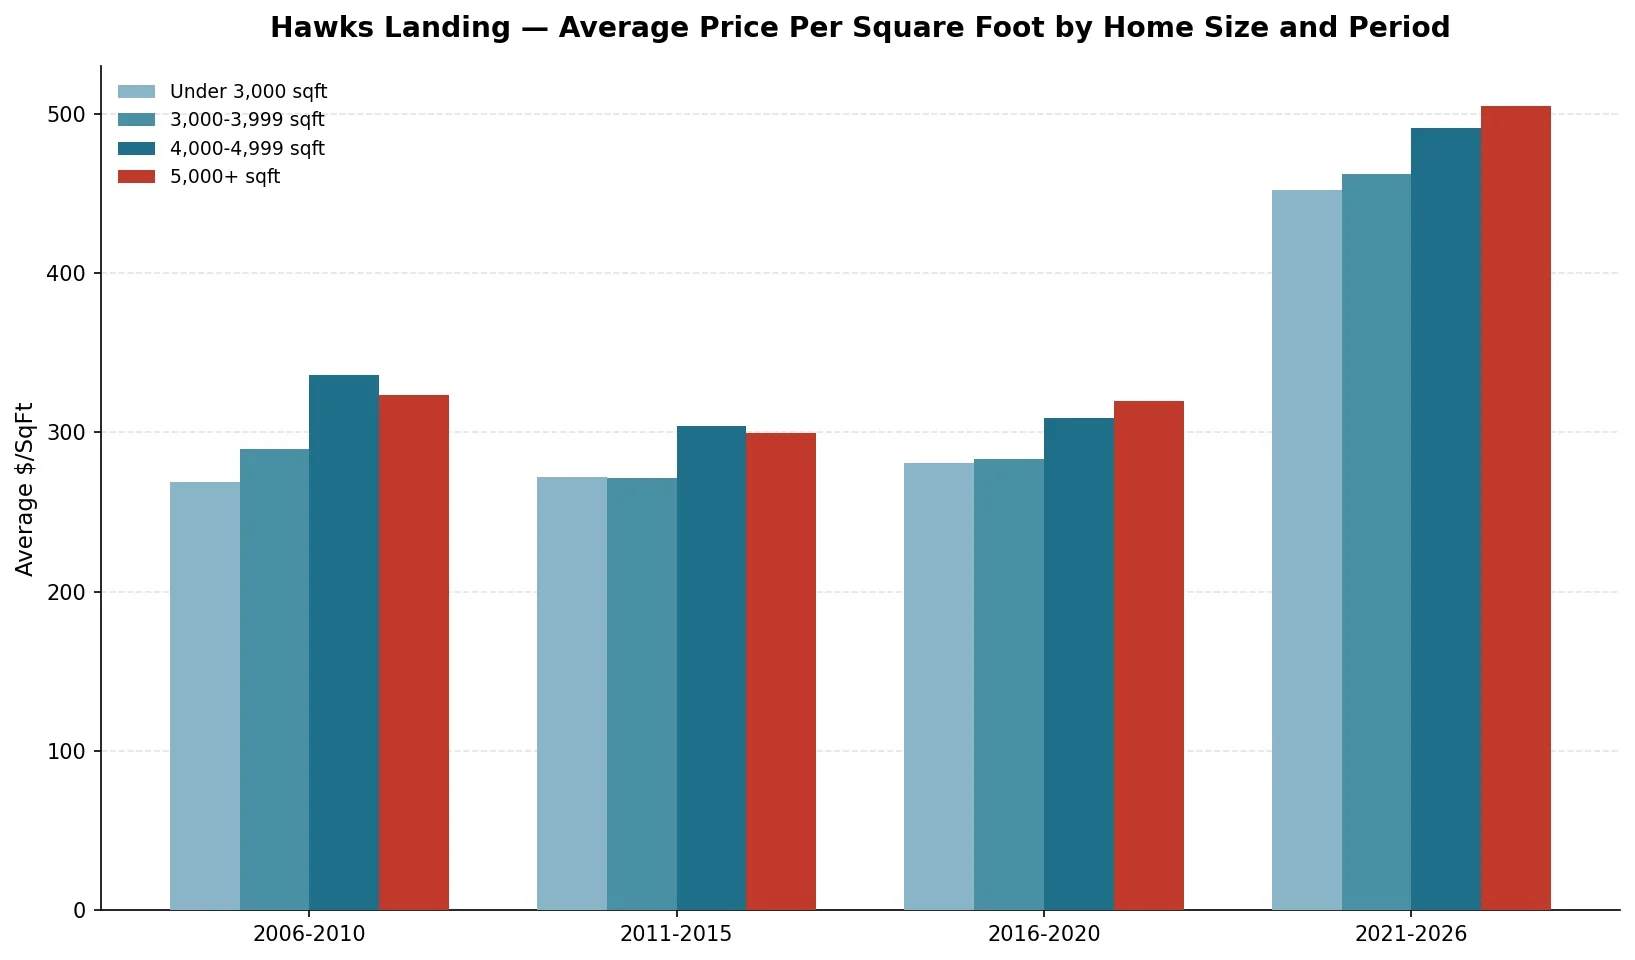
Two things stand out. First, larger homes have consistently commanded a higher price per square foot than smaller ones in nearly every period — the 5,000+ sqft group ran $300-$505 per foot, while homes under 3,000 sqft ran $269-$452. That means a single blended average actually understates what a seller with a larger home should expect per square foot, and can slightly overstate it for a smaller home. Second, and just as important: the post-2020 surge holds up inside every single size group, not just in the community-wide blended number. Every bracket jumped roughly 55-65% from the 2016-2020 period to 2021-2026. That confirms the price surge covered above is a real, size-controlled increase — not just a reflection of bigger homes happening to sell more often in recent years.
WHAT COVID ACTUALLY DID TO THIS MARKET, BY THE NUMBERS
- 2010 to 2020 growth rate: 1.3% per year, compounded.
- 2020 to 2025 growth rate: 13.3% per year, compounded.
At the 1.3% pace, reaching 2025's price level from 2020's would have taken roughly 47 years. It took 5.
Nationally, U.S. home prices rose about 40% from January 2020 to August 2022, after averaging just 3.5-4.2% annual growth beforehand — so this isn't a Hawks Landing-only story, but the local numbers above show exactly how it played out here.
PROPERTIES THAT SOLD, DROPPED, AND CAME BACK — WITH THE ACTUAL SALE PRICES
These are recorded closings, not estimates. 31 addresses in the data show a sale price drop followed by a later recovery. The clearest examples:
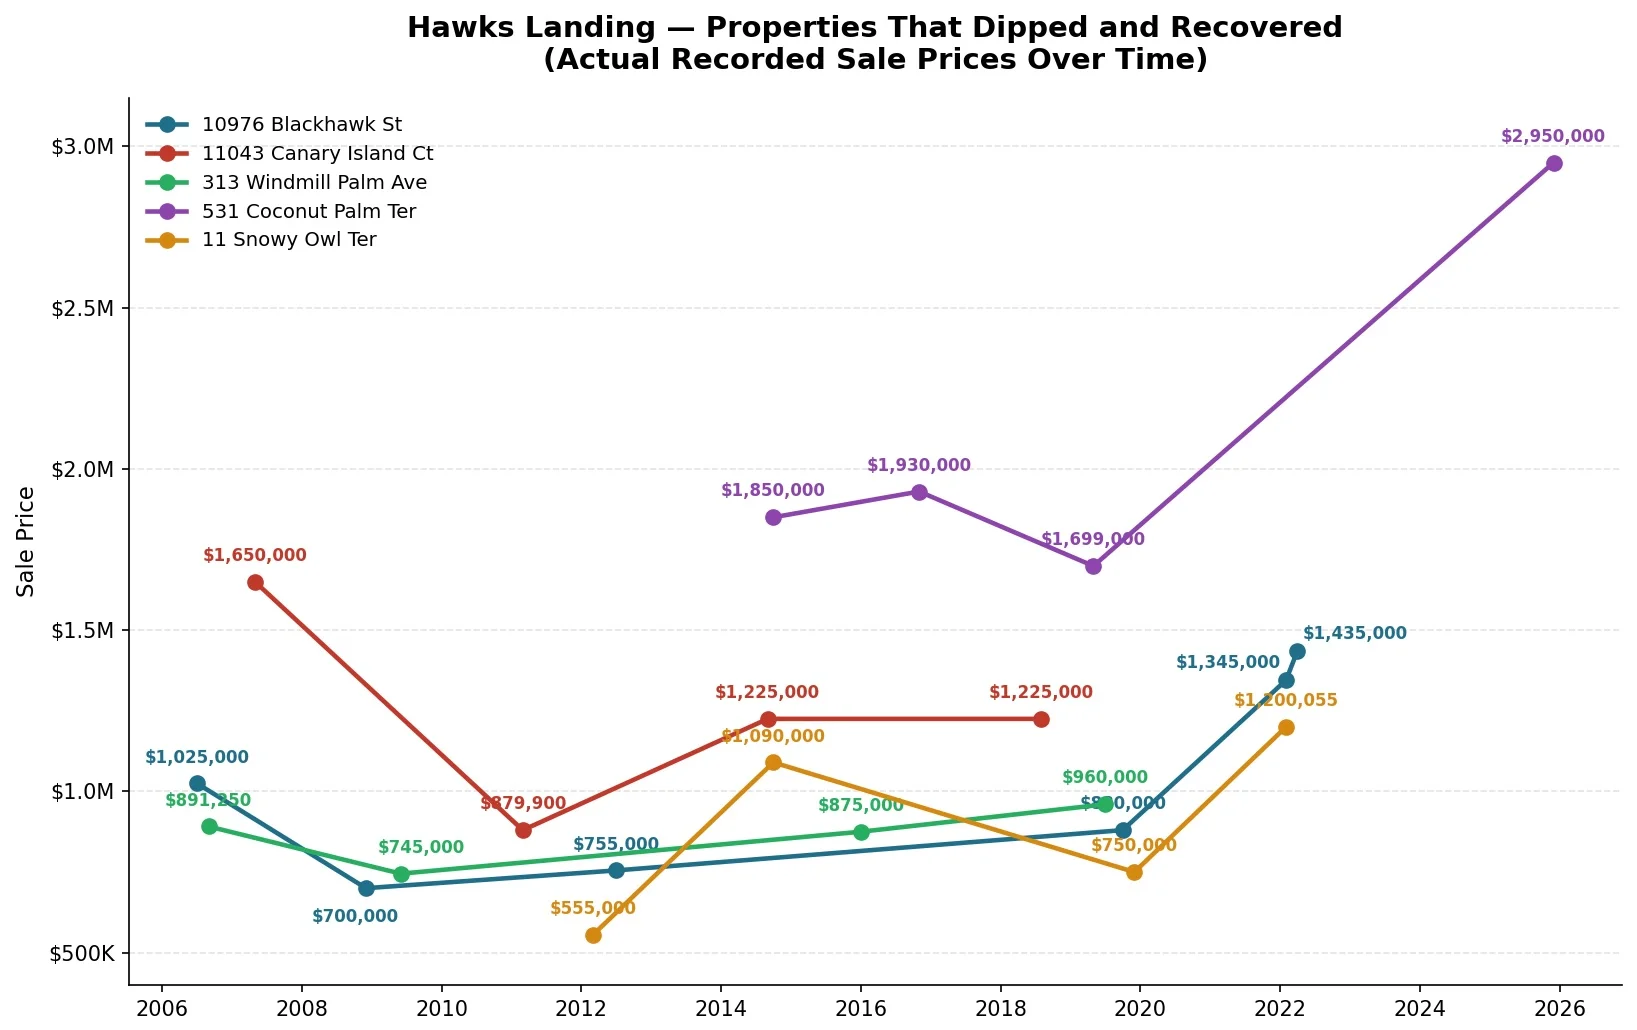
Every one of these addresses is worth the same conclusion: whoever held through the dip sold for more than the original price the next time it changed hands. Nobody who bought at the top and held through 2008-2012 lost money on paper by the time they sold — the loss only becomes real for someone forced to sell at the bottom.
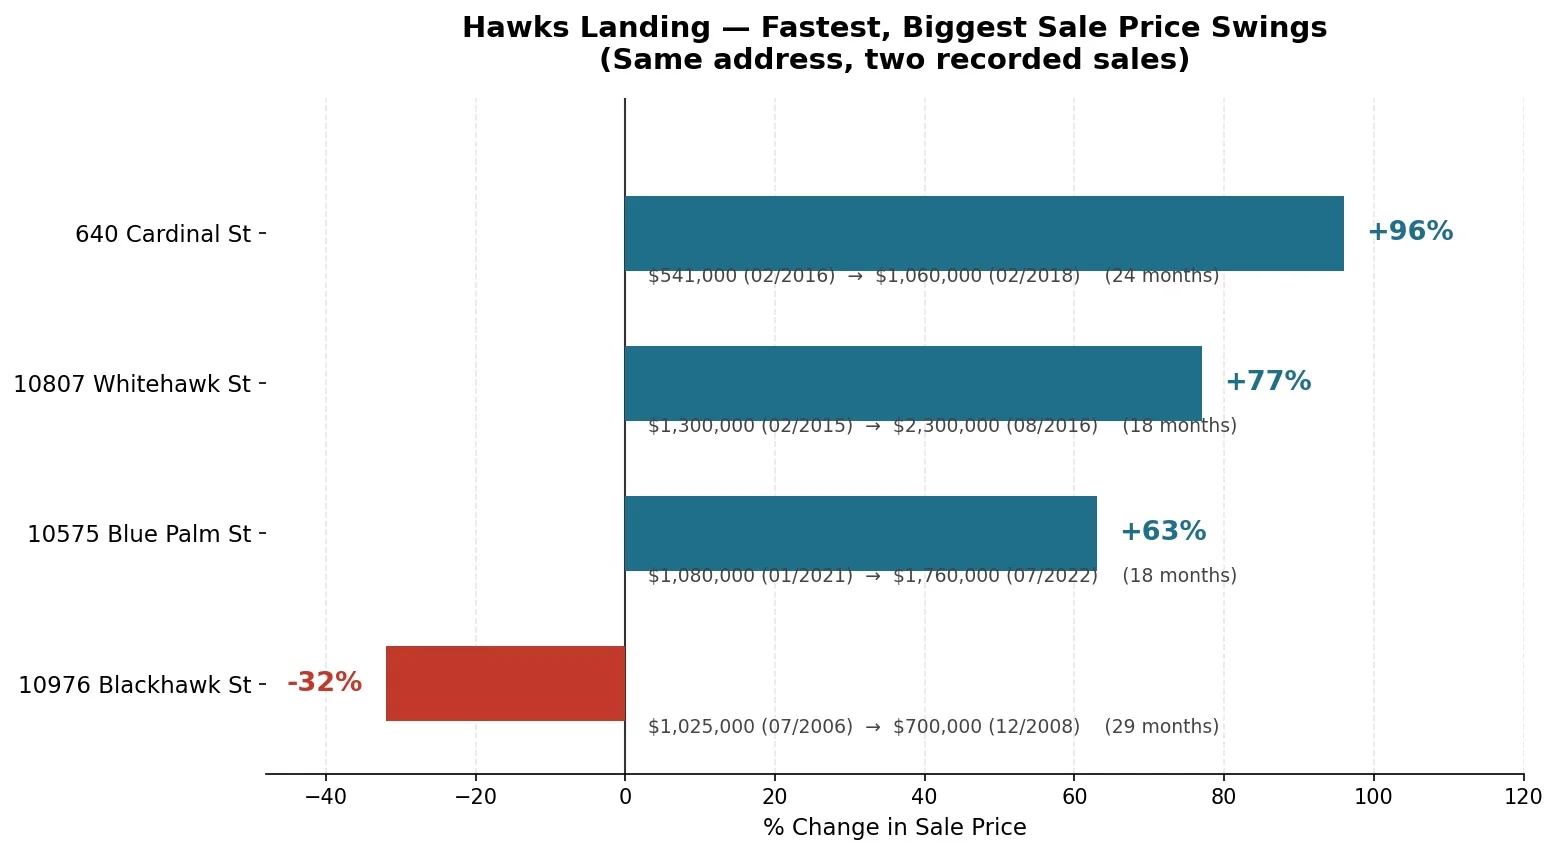
HAWKS LANDING STREET-BY-STREET APPRECIATION: EARLY ERA VS. TODAY
 Sweet Bay Ave was already the most expensive street in the early data — that's why its relative gain looks small even though its dollar values are high.
Location within the community also shows up directly in the numbers. Against the community-wide median of $300/sqft across all 20 years:
Hawks Landing Street — Median Sale Price — Median $/SqFt
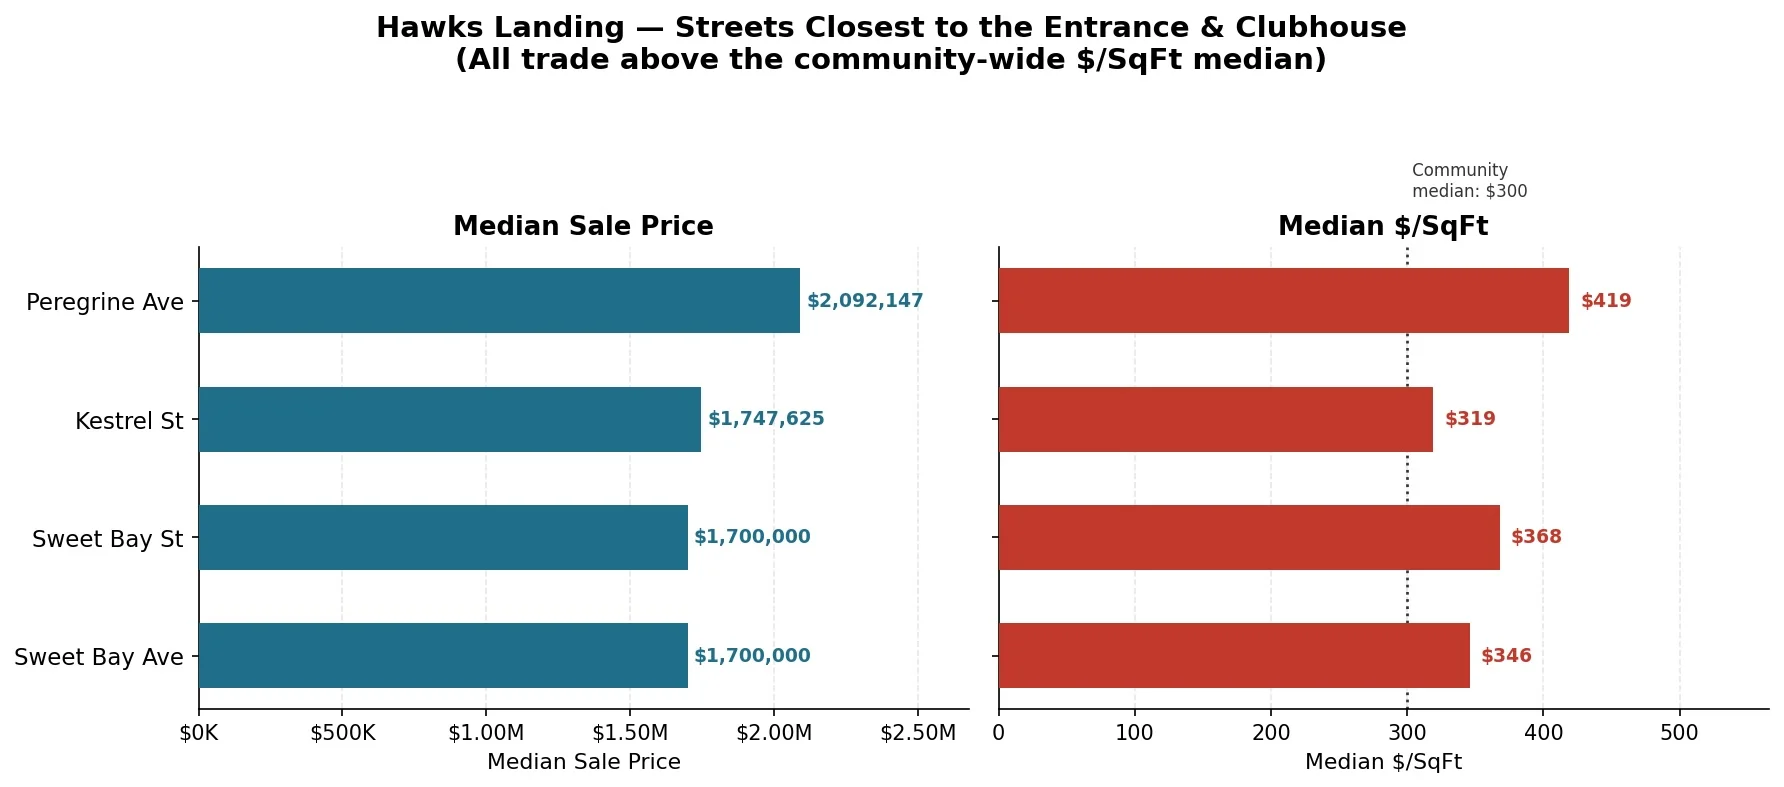
All four trade above the community median, and all four sit closer to the entrance and clubhouse.
HAWKS LANDING LOWEST AND HIGHEST RECORDED HOME SALES
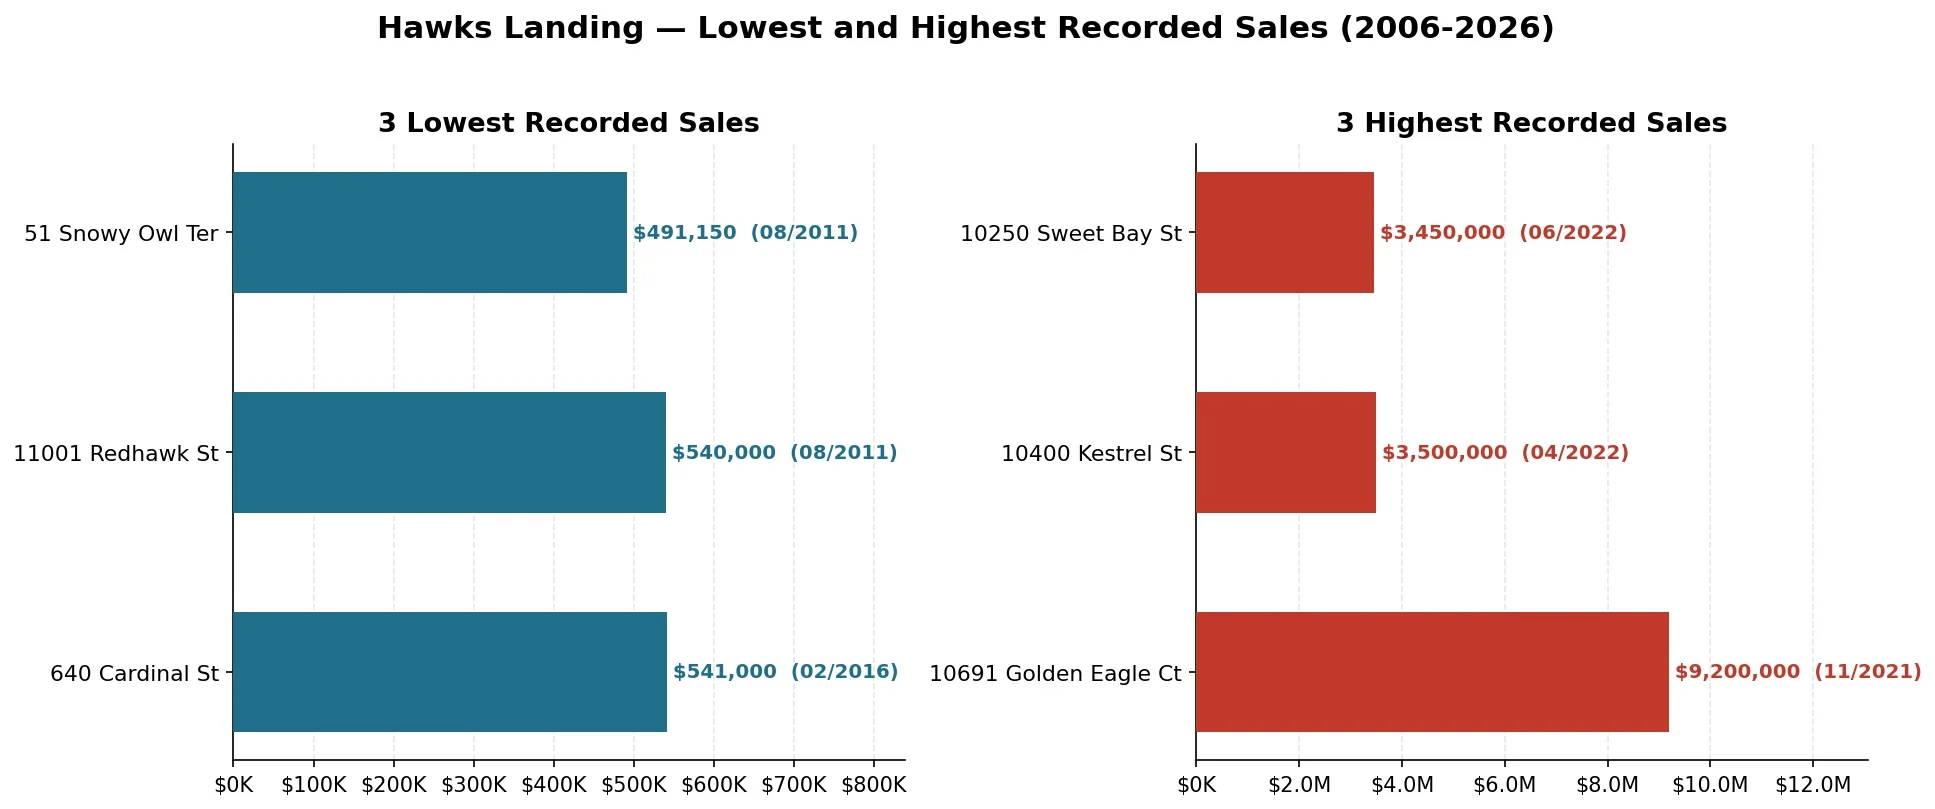
The highest sale in 20 years of data: 10691 Golden Eagle Ct, $9,200,000, closed 11/2021 (12,413 sqft). That same address sold in 2013 for $3,199,000, when the original 2007-built home was still standing. The buyer demolished it and rebuilt entirely — so the jump isn't appreciation, it's proof of what the lot alone was worth. That home was relisted in 2026 at $9,950,000, cut to $8,590,000, and has since been withdrawn without selling.
Hawks Landing POA DUES, 2006 VS. 2026
Year: Hawks Landing Quarterly POA Dues
-
2006 — $1,428
-
2026 — $3,160
That's a 121% increase over 20 years — more than doubling. Worth knowing, and worth weighing against the price and $/sqft gains shown above.
WHAT THIS MEANS IF YOU'RE THINKING ABOUT SELLING
Twenty years of complete sales data says three things clearly: this community goes through real down cycles, including one that cut prices 32%; the sellers who came out ahead were almost always the ones who weren't forced to sell during one; and pricing off a citywide trend, off a single blended $/sqft number, or even a same-subdivision comp from the wrong street or size range, can leave real money on the table in either direction. If you want to know what your specific lot, street, and home size have actually done over 20 years, that's the conversation I have with Hawks Landing homeowners before anything goes on the market.
FREQUENTLY ASKED QUESTIONS
Does Hawks Landing real estate always go up?
No — prices fell 32% from 2006 to 2009, and several individual addresses show real drops. What the data shows is that every property here that dipped and was held long-term eventually sold for more than its original price.
Why does the data only go back to 2006?
That's the full extent of MLS's electronic record for this community, and it lines up with when homes here first began reselling in real numbers.
Is every street in Hawks Landing worth the same?
No — 20-year $/sqft appreciation ranges from 11% to 118% depending on the street, and streets nearer the entrance and clubhouse consistently trade above the community median.
Does a bigger home mean a lower price per square foot?
No, the opposite tends to be true here. Larger homes (5,000+ sqft) have consistently traded at a higher price per square foot than smaller homes (under 3,000 sqft) across every period in the data.
What did COVID actually do to home values here?
It compressed roughly 47 years of the pre-2020 appreciation pace into about 5 years, based on this community's own before-and-after growth rates.
Thinking about what your Hawks Landing home is actually worth, based on real data instead of a generic estimate? I've lived in this community for nearly 20 years and work exclusively with sellers. Call or text me at 954-882-8900, email info@MicheleNoonanLLC.com, or DOWNLOAD my free Hawks Landing Seller Guide: HAWKS LANDING SELLER GUIDE
No pressure, no obligation — just straight answers about what your home is worth and how to sell it right.
Related Articles
5 Most Expensive Neighborhoods in Plantation
8 Most Popular Neighborhoods in Plantation FL
Michele Noonan is a listing specialist with Keller Williams Dedicated Professionals, licensed since 1996, with 600+ closed transactions and $350M+ in career sales. She has lived in Hawks Landing, Plantation, FL for nearly 20 years.
Raw Data:
HAWKS LANDING Average $/SqFt by home size and period:
Home Size — 2006-2010 — 2011-2015 — 2016-2020 — 2021-2026
Under 3,000 sqft — $269 — $272 — $281 — $452
3,000-3,999 sqft — $290 — $271 — $283 — $463
4,000-4,999 sqft — $336 — $304 — $309 — $491
5,000+ sqft — $324 — $300 — $320 — $505
- 10976 Blackhawk St — 6 recorded sales:
- $1,025,000 (07/2006) → $700,000 (12/2008) → $755,000 (07/2012) → $880,000 (10/2019) → $1,345,000 (02/2022) → $1,435,000 (04/2022)
- 11043 Canary Island Ct — 4 recorded sales:
- $1,650,000 (05/2007) → $879,900 (03/2011) → $1,225,000 (09/2014) → $1,225,000 (08/2018)
- 313 Windmill Palm Ave — 4 recorded sales:
- $891,250 (09/2006) → $745,000 (06/2009) → $875,000 (01/2016) → $960,000 (07/2019)
- 531 Coconut Palm Ter — 4 recorded sales, true up-down-up-down pattern:
- $1,850,000 (10/2014) → $1,930,000 (11/2016) → $1,699,000 (05/2019) → $2,950,000 (12/2025)
- 11 Snowy Owl Ter — 4 recorded sales, also up-down-up-down:
- $555,000 (03/2012) → $1,090,000 (10/2014) → $750,000 (12/2019) → $1,200,055 (02/2022)
HAWKS LANDING LOWEST AND HIGHEST RECORDED HOME SALES
Rank — Address — Price — Date
Lowest — 51 Snowy Owl Ter — $491,150 — 08/2011
2nd lowest — 11001 Redhawk St — $540,000 — 08/2011
3rd lowest — 640 Cardinal St — $541,000 — 02/2016
Highest — 10691 Golden Eagle Ct — $9,200,000 — 11/2021
2nd highest — 10400 Kestrel St — $3,500,000 — 04/2022
3rd highest — 10250 Sweet Bay St — $3,450,000 — 06/2022